Is the Australian retail scene is doing well? Vend sure think so, and they have the numbers to prove it. In Vend’s recent Retail Benchmarks Report, the company analysed the data of thousands of Australian retailers over the last financial year (April 2018 - March 2019) to surface key insights into their revenues, transactions, and customers... See how your business stacks up.
The Australian retail scene is doing well, and Vend has the numbers to prove it. In Vend’s recent Retail Benchmarks Report, the company analysed the data of thousands of Australian retailers over the last financial year (April 2018 - March 2019) to surface key insights into their revenues, transactions, and customers.
Here are some of the key findings from the report.
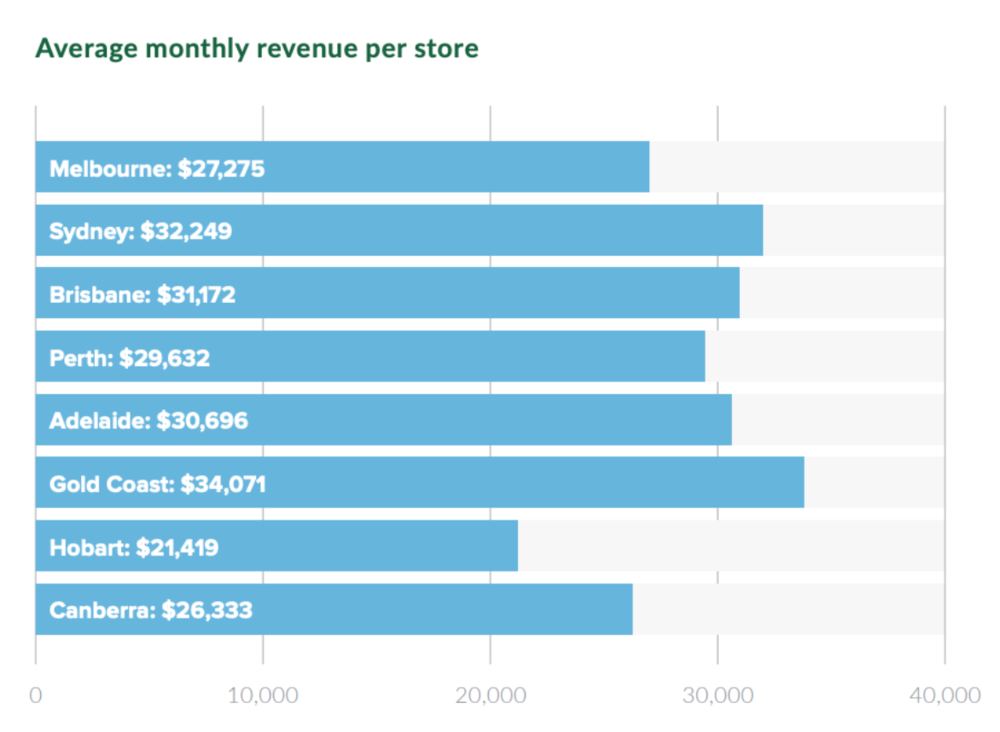
Overall, retailers in Australia had an average revenue of $39,906 AUD. Looking at the data from a regional perspective, Vend found that those in the Gold Coast were the top-grossing retailers, with average monthly revenues of $34,071 per store. Not too far behind are shops in Sydney and Brisbane, which had average monthly revenues of $32,249 and $31,172 respectively.
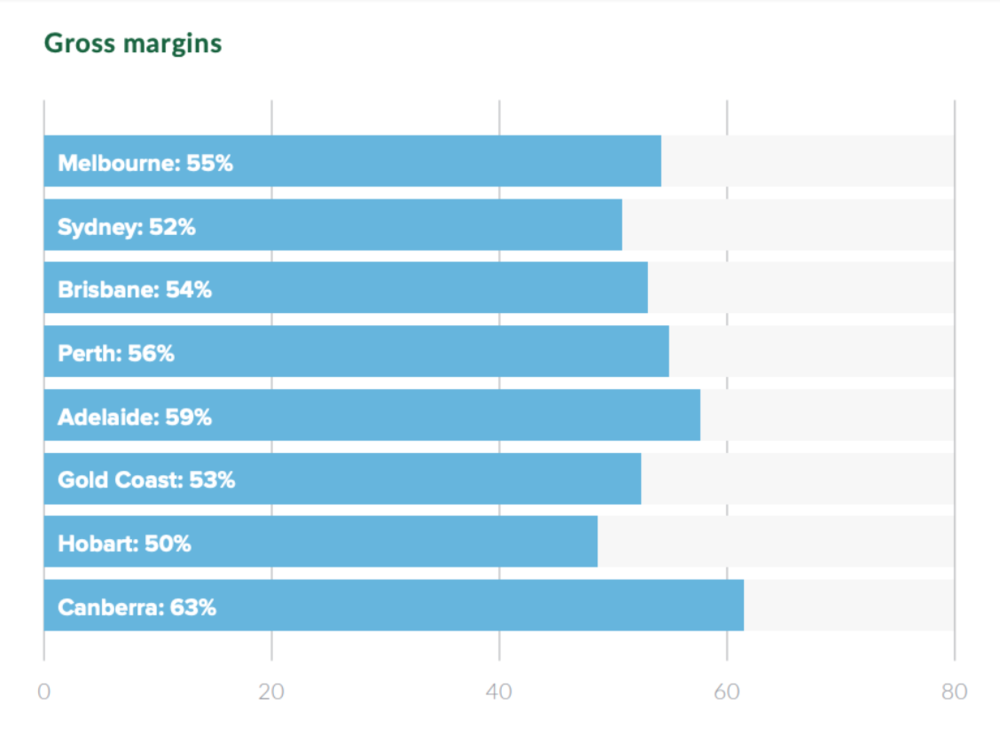
We all know that retail success isn’t just about revenue. Your profits also play a key role in the success of your store, which is why Vend analysed the profit margins of retailers across Australia.
Overall, Australian retailers had an average gross margin of 52.43%. Retailers in Canberra had the highest gross profit margin, with 63%, followed by Adelaide, with 59%. Meanwhile, retailers in Perth had a gross margin of 56%.
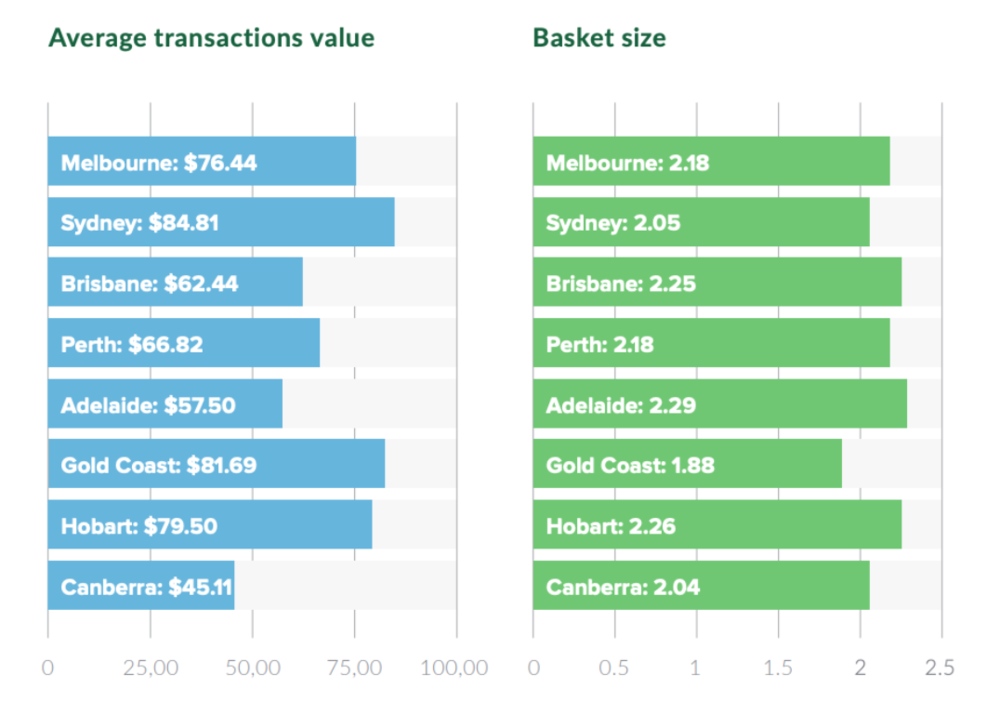
Vend also looked at the average transaction count, transaction values, and basket sizes of Australian retailers. Here’s what we found.
Retailers in Canberra had the highest results, with an average transaction count of 725 monthly transactions per store. They were followed by retailers in Adelaide, with 493 transactions, then Brisbane, with 466.
The full report includes data from retailers all over the world and across multiple industries.
If you’re curious about how Australian retailers measure up compared with other stores if you’re looking for insights into how different industries are performing, check out the full version of Vend’s 2019 Retail Benchmarks report below;
© 2024 AUSTRALIAN FASHION COUNCIL All Rights Reserved